5.2 Inferential Statistics: Can the Results Be Generalized to Population?
5.2.3 Describing the Relationship between Two (Ratio Scaled) Variables
Types of Relationships
Unless we perform a designed experiment, we can only claim an association between the predictor and response variables, not a causation
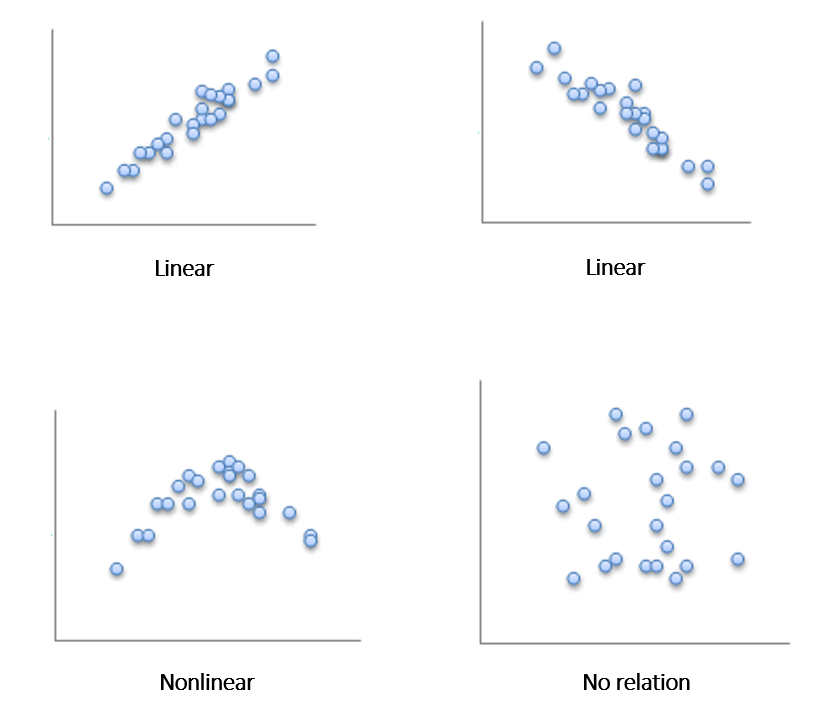
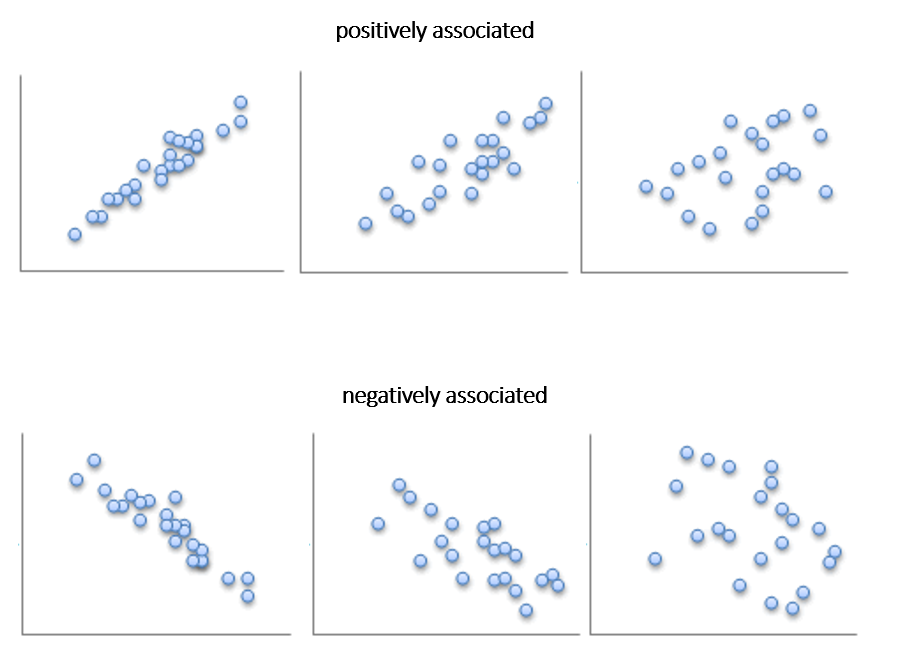
Linear Correlation
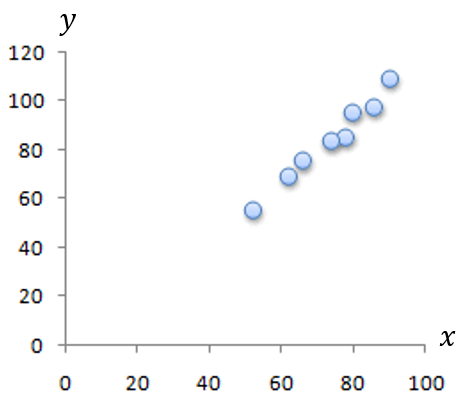
Two linearly related variables are positively associated if an increase in one causes an increase in the other.
Two linearly related variables are negatively associated if an increase in one causes a decrease in the other.
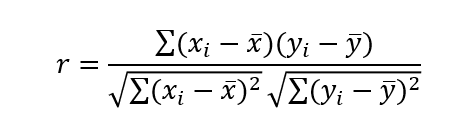
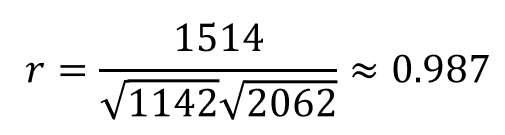
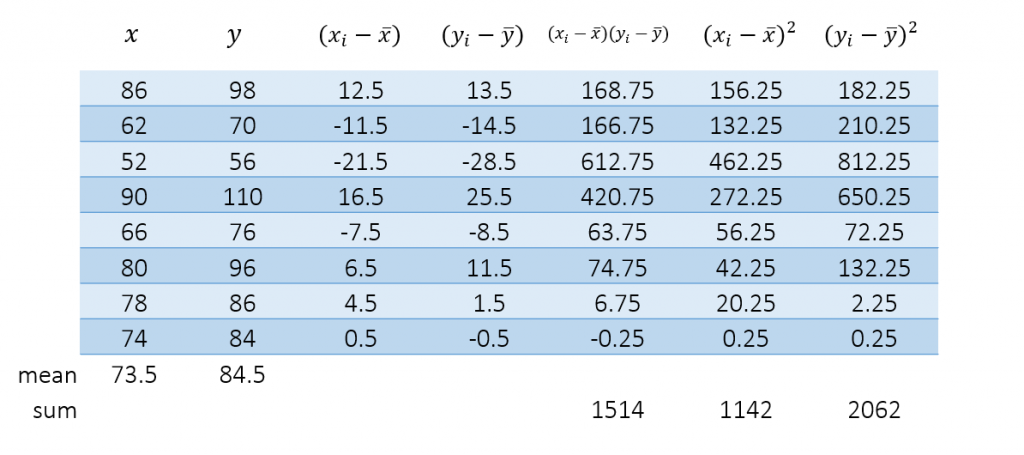
Linear Correlation Coefficient
(Pearson‘s) Linear Correlation Coefficient is a measure of the strength of the linear relationship between two variables.
Properties:
- The linear correlation coefficient is always between -1 and 1.
- If r = +1, there is a perfect positive linear relation between the two variables.
- If r = -1, there is a perfect negative linear relation between the two variables.
- The closer r is to +1, the stronger is the evidence of positive association between the two variables.
- The closer r is to -1, the stronger is the evidence of negative association between the two variables.
- If r is close to 0, there is little or no evidence of a linear relation between the two variables – this does not mean there is no relation, only that there is no linear relation.
Strength of relationship between variables
| Value | Interpretation |
| 0 to 0.3 | very weak |
| 0.3 to 0.5 | weak |
| 0.5 to 0.7 | medium |
| 0.7 to 0.9 | high |
| 0.9 to 1 | very high |
Ordinary Least-Squares (OLS) Regression
Regression Analysis is a powerful and flexible procedure for analyzing associative relationships between a metric dependent and one or more independent variables.
Allows to:
- Determine whether the relationship exists
- Quantify the strength of the relationship
- Derive the mathematical model / equation of the relationship
- Predict the values of the dependent variable
- Control for other independent variables when evaluating the contributions of a specific variable or set of variables
Examples:
- Can variation in sales be explained in terms of variation in advertising expenditure?
- Can the variation in market share be accounted for by the size of the sales force?
- Are consumer’s perceptions of quality determined by their perceptions of price?
What amount of goods will we sale if we spend €85,000 on advertising?
| Advertising expenditure€1,000 | Sales €1,000 |
| 40 | 377 |
| 60 | 507 |
| 70 | 555 |
| 110 | 779 |
| 150 | 869 |
| 160 | 818 |
| 190 | 862 |
| 200 | 817 |
Relationship between sales and advertisement
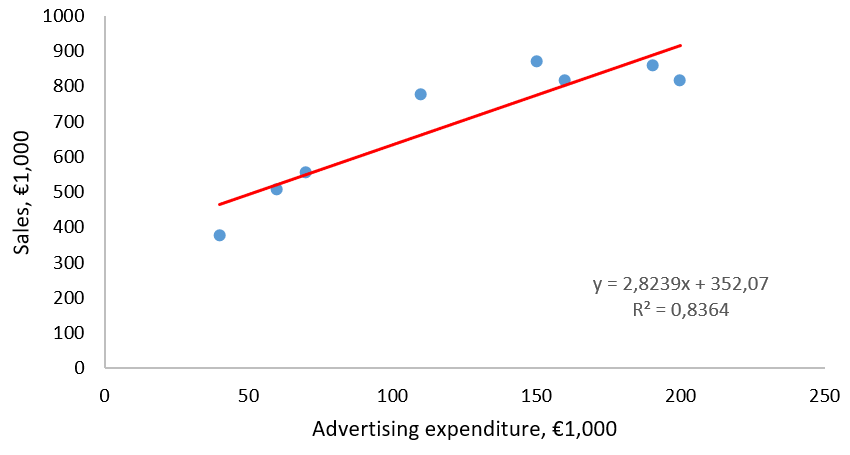
- Advertising expenditure explains 83.6% of the variance in sales.
- Each extra Euro spent on advertising gains €2.82 on additional sales.
- €85T ad spendings convert into
2.824∙85,000 + 325.07 = 240,383.57 sales. -
To the beginning of the section