5.2 Inferential Statistics: Can the Results Be Generalized to Population?
5.2.1 Hypotheses Testing
Hypothesis Testing
Hypothesis Testing is a five-step procedure using sample evidence and probability theory to determine whether the hypothesis is a reasonable statement.
In other words, it is a method to prove whether or not the results obtained on a randomly drawn sample are projectable to the whole population.
Procedure:
1.State null and alternative hypothesis
2.Select a level of significance
3.Identify the test statistic
4.Formulate a decision rule
5.Take a sample, arrive at a decision
People are ‘erroneously confident’ in their knowledge and underestimate the odds that their information or beliefs will be proved wrong. They tend to seek additional information in ways that confirm what they already believed.”
Max Bazerman
Sex and Internet Usage
| Sex | |||
| Internet usage | Male | Female | Row total |
| light | 5 | 10 | 15 |
| heavy | 10 | 5 | 15 |
| Column total | 15 | 15 | n=30 |
Based on this sample:
Q: Are there really more heavy internet users among males than among females in the general population?
Step 1: State null and alternative hypothesis
A null hypothesis (H0) is a statement of status quo, one of no difference or no effect.
An alternative hypothesis (H1) is one in which some difference or effect is expected.
H0: There is no difference between males and females w.r.t. internet usage.
IUm=IUf
H1: Males and females expose different internet usage behavior.
IUm≠IUf
Step 2: Select a level of significance
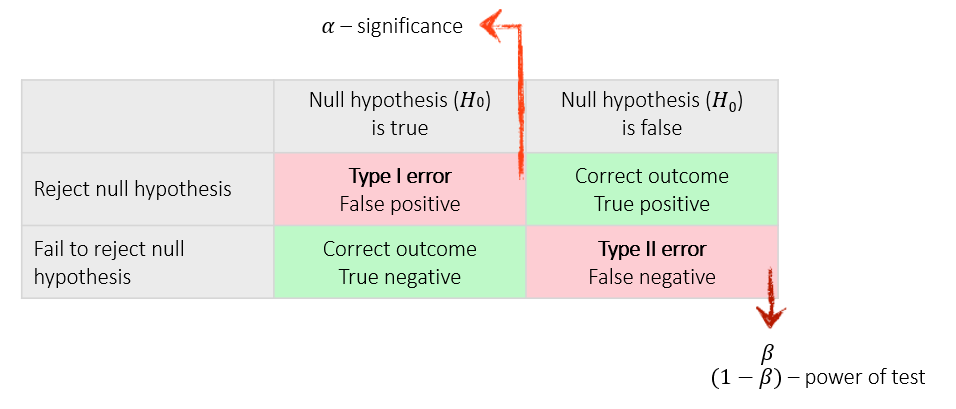
Significance (α) – probability of rejecting a true null hypothesis.
β – probability of accepting a false null hypothesis.
| Null hypothesis (H0) is true |
Null hypothesis (H0) is false |
|
|
Reject null hypothesis |
Type I error |
Correct outcome |
|
Fail to reject null hypothesis |
Correct outcome |
Type II error |
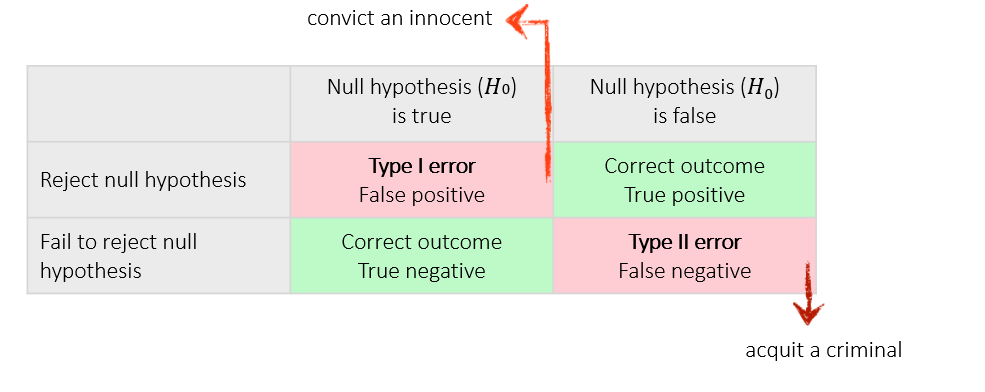
Analogy: innocence in a criminal trial
H0: the defendant is innocent
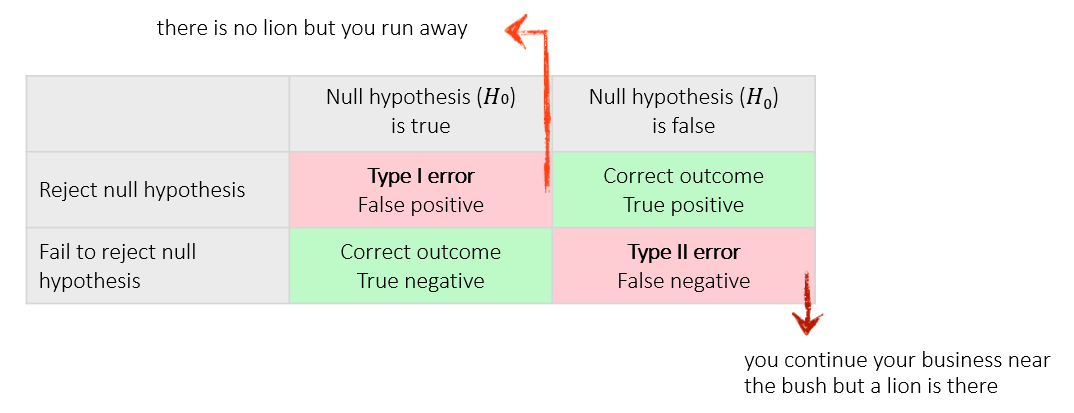
Analogy: Rustle in the bush – is it a lion?
H0: there is no lion in the bush
Levels of significance in marketing research
α – level of significance
0.01 (1%)
0.05 (5%)
(1-α) – level of confidence
0.99 (99%)
0.95 (95%)
Step 3: Identify the test statistic
| Sample | Application | Level of scaling | Test/Comments |
|
One Sample |
Distributions |
Non-metric |
Kolmogorow-Smirnow and χ2 test for goodness of fit; Runs test for randomness; Binomial test for goodness of fit of dichotomous variables |
| Means | Metric | t test, if variance is unknown
z test, if variance is known |
|
| Proportions | Metric | z test | |
|
Two Independent |
Distributions |
Non-metric |
Kolmogorow-Smirnow two-sample test for equality of two distributions |
| Means | Metric | Two-group t test
F test for equality of variances |
|
| Proportions | Metric Non-metric | z test
χ2 test |
|
| Ranking/Medians | Non-metric | Mann-Whitney U test is more powerful than the median test | |
|
Paired Samples |
Means |
Metric |
paired t test |
| Proportions | Non-metric | McNemar test for binary variables,
χ2 test |
|
| Ranking/Medians | Non-metric | Wilcoxon matched-pairs ranked-signs test is more powerful than the sign test |
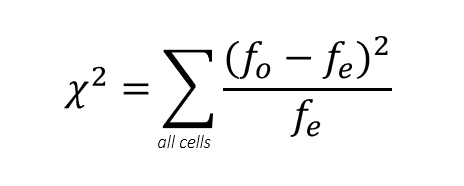
χ2 (chi-square) statistic for goodness of fit is used to test the statistical significance of the observed association in a cross-tabulation
H0: There is no association between the variables
χ2 (chi-square) tests the equality of frequency distributions.
Which distributions/frequencies should we test?
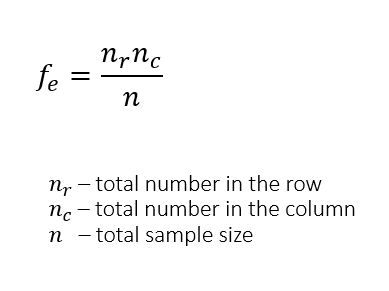
fe – cell frequencies that would be expected if no association were present between the variables
fo – actual observed cell frequencies
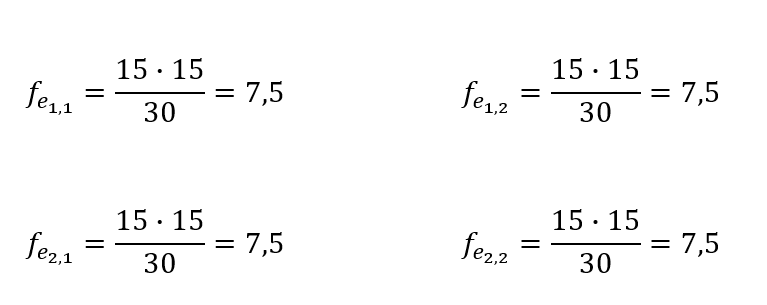
χ2 statistic should be estimated only on counts of data. When the data are in percentage form, they should be first converted to absolute values or numbers.
Step 4: Formulate a decision rule
TScal – observed value of the test statistic.
TScr – critical value of the test statistic for a given significance level.
If probability of TScal < significance level (α), then reject H0.
or
If TScal > TScr , then reject H0.
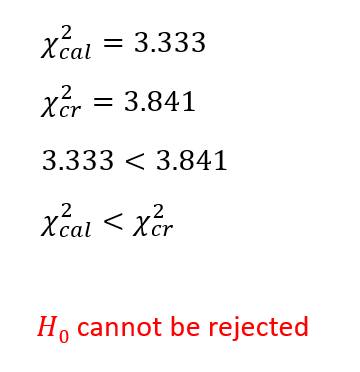
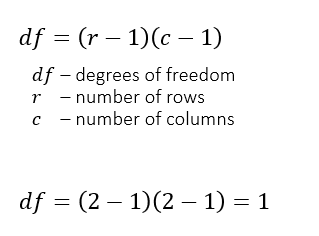
Table of critical values of χ2 for different levels of significance α
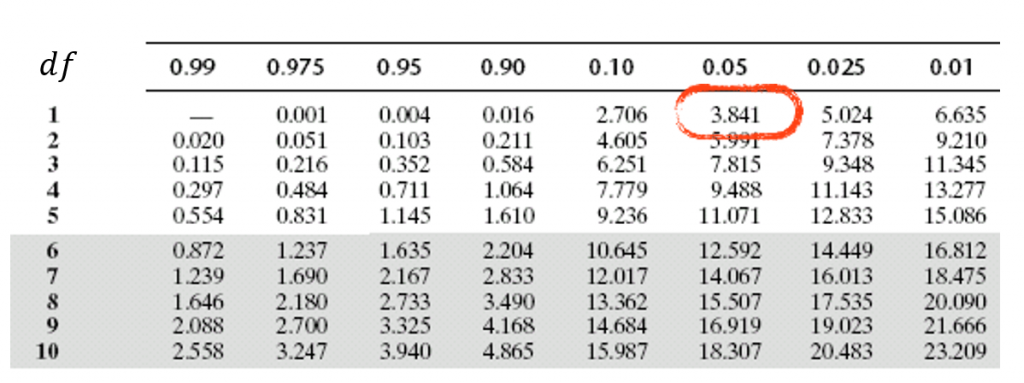
Step 5: Arrive at a decision
Is the evidence there?
What are the consequences?
- H0 of no association cannot be rejected
- Association is not statistically significant at the .05 level
- The findings from the sample cannot be generalized to population
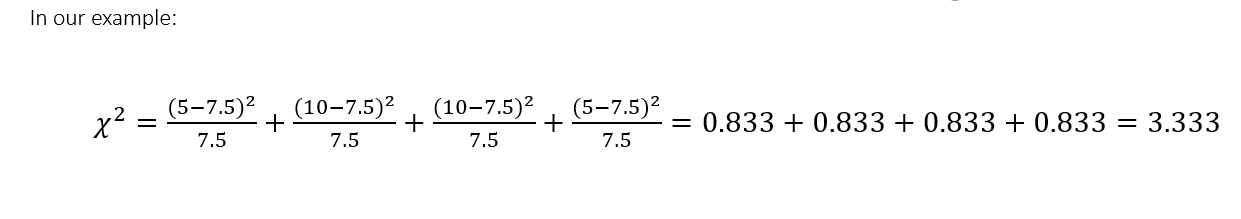
Sex and Internet Usage
| Sex | |||
| Internet usage | Male | Female | Row total |
| light | 5 | 10 | 15 |
| heavy | 10 | 5 | 15 |
| Column total | 15 | 15 | n=30 |
Based on this sample:
Q: Are there really more heavy internet users among males than among females in the general population?
A: The sample doesn’t provide such evidence.
If the sample was chosen and drawn appropriately, then we can state that there is no such relationship in the population at the 95% confidence level.
Otherwise – we don’t know.