5.2 Inferential Statistics: Can the Results Be Generalized to Population?
5.2.2 Strength of a Relationship in Cross-Tabulation
Measures of Strength of Association between Variables
χ2 tests only the significance of an association and provides no statements about its strength.
Simple proof: doubling all values in the table doubles χ2.
Measures of the strength of association are:
- Phi Coefficient (φ)
- Contingency Coefficient (CC)
- Cramer’s V
- Lambda Coefficient (λ)
Phi Coefficient
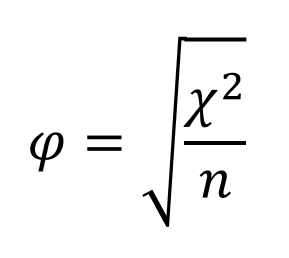
The higher φ, the stronger the association between the variables.
Values > .30 are considered substantial .
Problems:
- φ is not standardized, i.e., has a fixed upper limit of 1 only for 2×2 tables; depends on table’s dimensions.
- φ values from different studies cannot be compared.
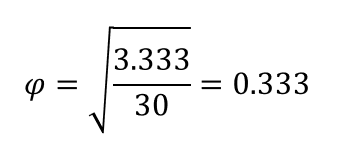
the association is not very strong
Contingency Coefficient
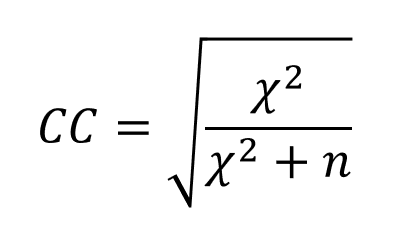
The higher CC, the stronger the association between the variables.
Values > .30 are considered substantial.
Although max. CC -value is limited by 1, it can be never achieved.
Problems:
- CC is not standardized, i.e., depends on table’s dimensions.
- CC values from different studies cannot be compared.
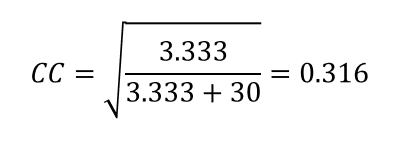
the association is not very strong
Cramer’s V
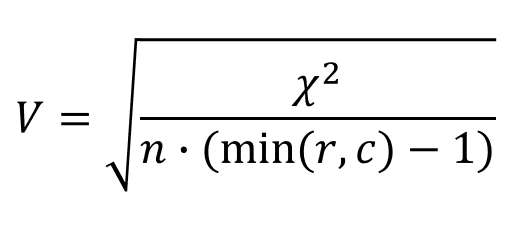
r – number of rows
c – number of columns
The higher V, the stronger the association between the variables.
Values > .30 are considered substantial.
maximum V -value is limited by 1, it can only be achieved in case of 2×2 tables.
Problems:
- V is not standardized, i.e., depends on table’s dimensions.
- V values from different studies cannot be compared.
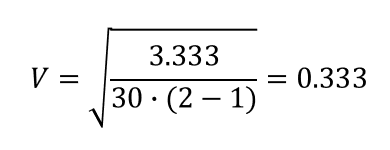
the association is not very strong
Lambda Coefficient
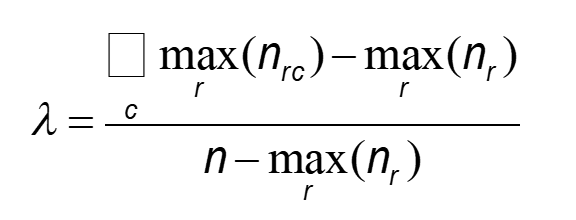
r – row index
c – column index
Measures the percentage improvement in predicting the value of the dependent variable, given the value of the independent variable.
Is standardized between 0 and 1 (1 indicates that the prediction can be made without error, 0 means no improvement in prediction).
Hence, λ-values can be compared among different studies.
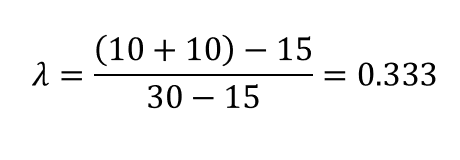
Knowledge of sex increases our predictive ability by the proportion of 0.333, i.e., a 33.3% improvement.
To the beginning of the section